Introduction
The library is a storehouse of knowledge, not a storehouse of books, journals, magazines, and other materials. In this context, the job of librarians and other professionals is to effectively convey knowledge to the users. The effective method means providing access to the user through the latest popular media by obtaining information material from authentic sources. At present, users do not need to visit the library physically to get their desired study materials (Elaturoti, 2021). Today's libraries are capable of providing the appropriate information to their users with the help of technology, and users are also capable of getting digital information from e-resources. If we want to keep any service or product useful for a long time, it is very important to assess the status of effectiveness or usefulness after a stipulated period (White, 2012).1, 2, 3, 4, 5
With the expansion of the digital information sector, there is a need for qualified and trained personnel in digital information literacy because today’s library materials and services are now provided through library web portals, social media tools, and mobile apps. Popular search engines like Google and Bing, etc., are providing universal availability of digital information along with easy search facilities in the form of popular media. But even today, the educational community relies on the resources of the library for reliable information (Azubuike & George, 2020). It requires the library staff to constantly keep themselves up-to-date with a different approach so that the information needs of the users are met with the latest techniques at the earliest. In the current corona pandemic, it is important to provide a safe educational environment, keeping safety in mind. Libraries should also make digital information available to users on a large scale, indirectly and in a meaningful way, keeping in mind the safety rules. Online is the best medium for its users, and the study work of users is not affected (Dr, 2021).
The National Digital Library of India (NDLI), designed by the Indian Institute of Technology Kharagpur, had 3 million users in March 2021. This remarkable figure suggests that library materials and services can form a major part of the information needs of the campus or its outside users if they are designed according to the thinking and needs of the new generation of users(India, 2021). As a result, in order to meet the informational needs of users, every academic library must manage its informational content effectively. The Nehru Library is a well-known information Centre that delivers information related to agriculture and animal husbandry studies in Haryana. It provides document delivery services as well as digital library services to the academic community with the latest techniques (eLibrary, 2016-21).6, 7, 8, 9, 10, 11, 12
Today's educational libraries are playing a vital role in the education system with their digital information resources. They are able to provide access to the unlimited world of ideas. Since most of the higher education institutions' activities take place outside the classroom, in such situations, libraries play a special role. Digital libraries are able to provide easy access to e-books, e-journals, e-thesis, e-magazines, and other electronic reading materials as per curriculum to users located anywhere in the world through a simple web process. These libraries are also playing an important role in learning apart from courses, such as writing papers; related to lifelong learning; keeping oneself updated with the subject-related information, and Keeping himself updated about other subjects (By Sharon Johnson, 2012; Rath, 2019).
For the last 20 years, libraries have been adjusting their collections, services, and environments to digital resources. Even before the ubiquitous use of the Internet, library scholars were using off-line cataloguing technology in display systems to access databases (Prakash Abraham, 2020).With the explosion of Internet technology, libraries incorporated a wide range of digital material resources into their activities: updating your buildings' network, wiring, and wireless infrastructure; and designing new virtual and personal services. The study will also explore how libraries can adapt to the needs of a new generation of users in several specific areas and what changes are needed to successfully operate information services (Dar, 2017).
The new generation of library users means those users who are capable of using information and communication technology in the context of information resources in the field of teaching and learning. They are also able to use IT tools, use the Internet with ease, are proficient at multitasking, and are connected to each other online.
In order to better serve their users, library administrations need to be aware of the differences between the three main generations of library patrons: Baby Boomers, Gen Xers, and Millennials. It has been proven that each generation has its own information-seeking preferences, behaviors, and backgrounds (A. Becker, 2019).But in academic libraries, the needs of the users are as per their respective subject approaches. Therefore, for academic libraries to serve each category most effectively, it is essential that they become knowledgeable about their characteristics, how they approach and adopt new technologies, how they communicate with each group, and how they apply most effective methods in thier services. Gaining insight into the different categories of library users also has an impact on library marketing and collection development (Asif & K. Singh, 2019).13
Background
Choudhary Charan Singh Haryana Agricultural University (CCSHAU), Hisar (Haryana),
Is the largest agricultural university in Asia. It is spread over 6084 acres and includes the university campus and farmhouse equipped with laboratories, besides the regional Centre spread over 1418 acres in the state. The Haryana Agriculture University was duly established on February 2nd, 1970. On October 31st, 1991, the name was changed to "Choudhary Charan Singh Haryana Agricultural University", who is known as a great leader of farmers(CCS Haryana Agricultural University, 2016).
Nehru Library, CCSHAU
The Nehru Library, situated in the heart of the university, has been continuously satiating the knowledge glut of its academic community through its high-quality reading materials. New ICT, multidisciplinary, and interdisciplinary research have changed the nature of the library's resources.
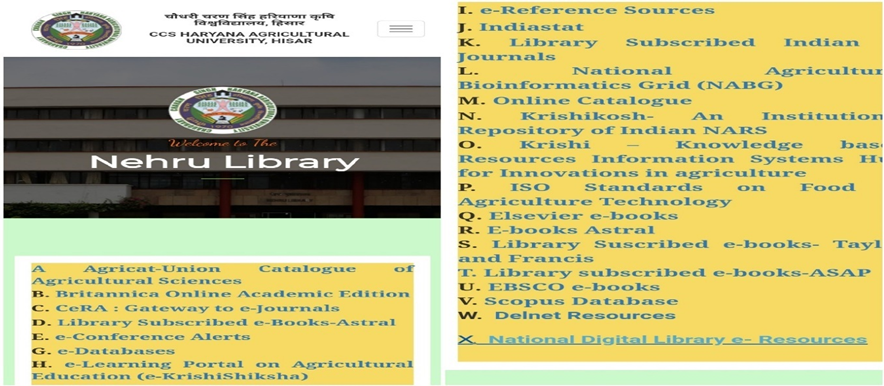
Since 2016, the CCSHAU e-Library web portal has been providing over 500,000 e-Resources, including top peer-reviewed e-Journals and e-Books from world-class publishers, 24*7 to New Generation Users. The details of all the e-resources are given below:
To meet scholarly and informational needs, it subscribes to 3,11,097 volumes of books, a bound volume of periodicals, 694 periodicals, of which 225 are foreign, and a very rich collection of other reading material. The library has provided a rich collection in major fields like agricultural engineering, agricultural science, home science, basic science (biochemistry, biotechnology, microbiology, genetics, botany, chemistry, fisheries, sociology, and zoology), food science, and technology (eLibrary, 2016-21). The Lala Lajpat Rai University of Veterinary and Animal Science is also located on this campus due to this library's keeping a large collection in animal science, veterinary science, and animal husbandry science and providing its services. A large number of books on science and general interest are also available in the library. The Nehru Library maintains exchange relations with many Indian and foreign administrators. The official publications of the university are Haryana Kheti, Haryana Veterinary Doctor, HAU Journal of Research, and Thesis Abstract, which form the backbone of the exchange program.
Research Methodology
In this study, the surveyor has taken 50 (100%) library users from the Nehru Library, respectively. At present 3567 online active users in the Nehru university library. Total sample size is 50 (100%) 10 (20%) faculty members, 20 (40%) research scholars, 10 (20%) PG students, 10 (20%) UG students) respondents, one respondent represent 71 library users. Out of the 50 (100%) respondents, 41 (82%) are male and 9 (18%) are female library users.
For data collection, the surveyor used the following questionnaire, observation, and interview techniques: The researcher has personally visited the Nehru Library, studied all the technical and maintenance sections of the library along with the digital library section, and interacted face-to-face with the staff and users. The researcher first met the respondents and then discussed the given study topic in detail with them. In this study, the surveyor used digital technology and a "Google Doc" questionnaire for data collection so that corona infection does not spread and it is also a paperless process.
The researcher sent a Google Doc questionnaire to the respondents on his/her Whats App and email addresses. The respondents carefully read all the questions and submitted their feedback through this digital questionnaire. The four groups (UG and PG students, Research Scholars, and Faculty Members) of library users were asked about their perceptions, opinions, beliefs, and attitudes towards the library's e-resources and service. The study employed a basic method of an objective type survey to evaluate users’ satisfaction with various digital library services at the Nehru Library. The main instrument for data collection was a questionnaire. The questionnaire was brief and structured. Respondents were given time to complete the questionnaire carefully and submit it.
Scope of The Study
Through this study, the researcher analyzed the behavior approach of library users towards the digital library initiative (e-Service& e-Resource) of the Nehru Library by obtaining feedback. This is because university libraries are increasingly converting their resources and services into digital forms without knowing the perception of their users. University libraries are spending a huge amount of money on the digitization project. In this study, the researcher analyzed the satisfaction level of users in the context of these information services and sources and the changes they wanted to make in this scenario. It will also help the university library administration to develop and implement new projects for accessing the right information at the right time and in the right way.
User feedback, or user-centred institutional operation, is one of the core values of every library. Therefore, in order to improve the document delivery service of the Nehru Library, it is necessary to review these services regularly. The overall objective of the study is to determine the current level of satisfaction with the services being provided and the extent to which current needs are being met. The specific objectives of this research are to assess, with a representative sample of students, researchers, and academic staff.
Finding and Recommendations
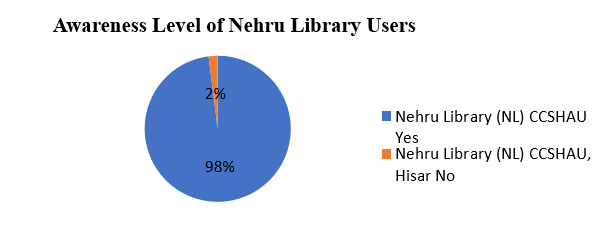
Figure 1 Show that 98% of library users are aware of the digital services and e-services of their university library and only 2% are not aware of these services. The awareness level of the Nehru Library users is very high. The majority of library users are aware about the digital library services and resources of Nehru Library.
Table 1
Behavioural approach of users about usingthe Nehru Library.
Table 1 Shows that 16 (32%) of users have been using digital resources for more than 4 years, 13 (28%) from 2-3 years, and 8 (16%) from 6 months - 1 year, 6 (12%) from 1-2 years, and 6 (12%) less than 6 months. About 44 (80%) of the users have used digital resources in the last year, which shows that most of the users are experienced in the use of digital services, and the corona era has also increased the trend of using digital resources.
Table 2
Timespending frequency of library users according to status.
Table 2 Shows the status-wise frequency of library users, out of 50 (100%) visitor frequency. Out of 10 (20%) faculty members, 5 (10%) visited twice a week, 2 (4%) once every fifteen days and 2 (4%) once a month. 1 (2%) had not clicked no option. Out of 20 (40%) research scholars, 13 (28%) visited daily, 4 (8%) twice a week, 1 (2%) once every fifteen days, and 1 (2%) once a month. Out of 10 (20%) PG students, 6 (12%) visited daily, 3 (6%) twice a week, and 1 (2%) once every fifteen days. Out of 10 (20%) UG students, 6 (12%) were visited daily and 4 (8%) were visited twice a week.
Table 3
Frequency of users about the using digital resources.
Table 3 Below presents the time spent by the users in the digital library section in a week using digital resources. Out of 50 (100%)respondents, 17 (34%) spend 5–6 hours per week, 15 (30%) spend 2-3 hours, and 8 (16%) spend 10–20 hours, 6 (12%) less than an hour, and 4 (8%) over 20 hours in a week.
Table 4
Status fromwhere library users got help in accessing digital library e-services.
Table 4 Shows that out of 50 (100%) library users, 19 (38%) are accessing digital library services under the guidance of friends, 17 (34%) from self-instruction, 11 (22%) from university library training, and 3 (6%) in some other way. From the findings obtained, it is suggested to the university library administration that STC, workshops, and seminars on the related subject should be organized from time to time so that maximum users can benefit.
Table 5
Uutility level of digital library services and resources.
Table 5 Shows that out of 10 (20%) faculty members, 9 (18%) are using digital library services and resources for research work and 1 (2%) for any other work. Out of 20 (40%) research scholars, 17 (34%) are using digital library services and resources for research work and 3 (6%) for learning. Out of 10 (20%) PG students, 5 (10%) are using the digital library for research and 5 (10%) are learning. Out of 10 (20%) UG students, 2 (4%) are using digital library services and resources for research and eight (16%) for learning.
Table 6
Browsing status of digital library users about the information.
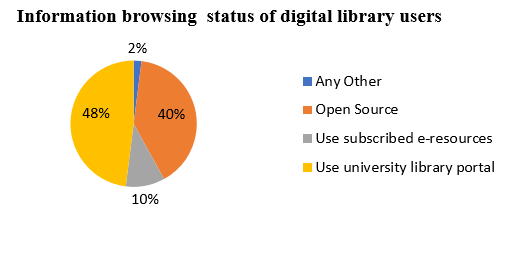
Figure 2 Shows the overall browsing status of digital library users, and Table 6 shows user’s status-wise browsing fields. Today’s the different web channels used by Nehru Library users to access their required information. As per the survey, out of 10 (20%) faculty members, 5 (10%) university library portals, 3 (6%) open sources, 1 (2%) subscribed e-resources, and 1 (2%) any other sources. Out of 20 (40%) research scholars, 10 (20%) university library portals, 8 (16%) open sources, and 2 (4%) subscribed e-resources. 10 (20%) PG students, 5 (10%) university library portal, 4 (8%) open sources, and 1 (2%) e-resources subscribed Out of 10 (20%) UG students, 4 (8%) used the university library portal, 5 (10%) used open sources, and 1(2%) used subscribed e-resources. As per findings, most library users use university library portals, and they believe that university library portals provide more authentic and reliable data. So, the survey recommended that the university library make its digital library webpage more accessible and informative.
Table 7
Library users Problems (physical and mentally) in using digital services of library by the users.
Table 7 Shows that out of 10 (20%) faculty members, 1 (2%) had problems with declining writing skills, 1 (2%) had fewer face-to-face conversations, and 8 (16%) had no problems. Out of 10 (40%) researchers, 3 (6%) felt that they had declined in writing skills, 1 (2%) had inappropriate information at a young age, 1 (2%) incidents of fraud, 2 (4%) loss of concentration, 1 (2%) reduced facial interactions, 1 (2%) obesity, 1 (2%) social disconnect, and 5 (10) none. Out of 10 (20%) PG students, 2 (4%) feel that their writing skills have declined, 2 (4%) have decreased concentration, 1 (2%) has had fewer face-to-face interactions, 1 (2%) is experiencing social disconnection, and 3 (6%) none. Out of 20% of UG students, 3 (6%) had a decline in writing skills, 1 (2%) had incidents of cheating, 3 (6%) lost concentration, 2 (4%) had fewer facial interactions, and 1 (2%) had obesity problems. Keeping in mind that the majority of users have no problems using digital library facilities, every effort should be made to solve their problems.
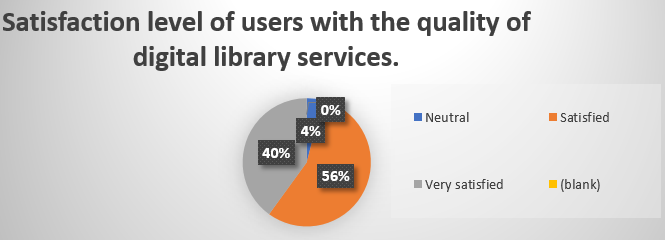
Figure 3 Show the satisfaction level of users is high with the quality of digital library services. Out of 50 (100%) users, 20 (40%) are very satisfied with the quality of library services, 23 (56%) are satisfied, and 2 (4%) are neutral. The digital services that are provided by the Nehru Library are well organized and designed. Its credit goes to library administration and management.
Table 8
Utility level of e- resources as compare to conventional documents ofthe library users.
Table 8 Shows the behavioral approach of the users toward e-resources as compared to conventional documents. Out of ten (20%) faculty members, almost all believe that e-resources are more time-saving, informative, preferred, effective, and flexible; nine (18%) believe that they are simple to use and manage; and one (2%) has concerns about using e-resources. Out of 20 (40%) research scholars, 20 (40%) say that e-resources are time-saving, 17 (34%) prefer e-resources and think that e-resources are more informative as compared to conventional documents, and 3 (6%) disagree. 18 (36%) feel that e-resources are easy to use, easy to handle, and effective as compared to conventional documents, while 2 (4%) do not agree with these opinions. Out of 10 (20%) PG students, 9 (18%) believe that e-resources are time-saving, easy to handle, and effective compared to conventional documents, and 1 (2%) do not agree with them. On the other hand, 10 (20%) say that e-resources are informative, flexible, and easy to use; 8 (16%) prefer e-resources compared to convention documents; and 2 (4%) ignored this opinion. Out of 10 (20%) UG students, 8 (16%) say that e-resources are time-saving and effective compared to conventional documents and 2 (4%) do not agree with them. 9 (18%) say that e-resources are informative, effective, and easy to handle and 1 (2%) don’t agree with them. 7 (14%) prefer e-resources as compared to conventional documents and 3 (6%) don’t agree with that opinion. 10 (20%) think that e-resources are easy to use.
Table 9
Satisfaction level of users with the fallowing technical services.
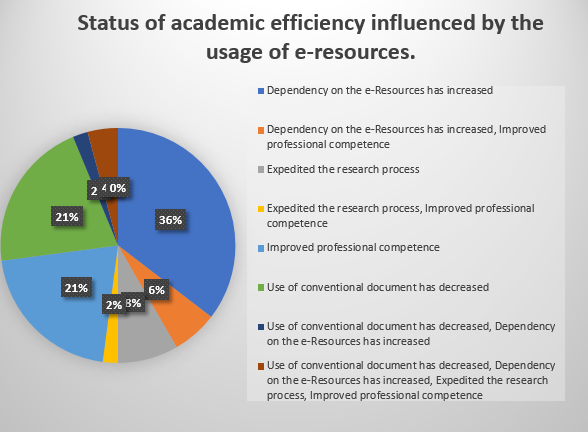
Figure 4 Show that e-resources influenced the users in different areas. Out of 50 (100%) library users, 17 (34%) believe that their reliance on e-resources has increased, 10 (20%) believe that their professional competence has improved, 10 (20%) believe that their use of conventional documents has decreased, 4 (8%) believe that their reliance on e-resources has increased and also improved professional competency, and 2 (4%) believe that their use of conventional documents has decreased, reliance on e-resources has increased, expedited the research process, and improved professional competency.
Table 9 Shows the satisfaction level of users with the following technical services:
20 (40% of library users are highly satisfied with bibliographic services, 23 (54%) are satisfied and 3 (6%) are neutral.
20 (40%) of library users are highly satisfied with abstracting services, 26 (52%) are satisfied and 4 (8%) are neutral.
17 (34%) of library users are highly satisfied with the full-text services, 26 (52%) are satisfied, 6 (12%) are neutral, and 2 (4%) are dissatisfied.
11 (22%) of library users are highly satisfied with graphic services, 23 (56%) are satisfied and 11 (22%) are neutral.
16 (32%) of library users are highly satisfied with audio and visual services, 23 (46%) are satisfied, 10 (20%) are neutral, and 1 (2%) are dissatisfied.
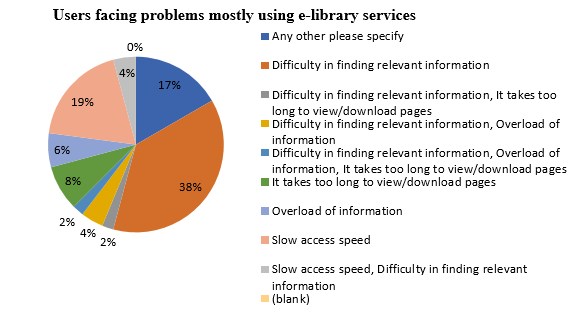
Figure 5 Shows the most users facing problems while using e-resources in the digital library. Out of 50 (100%), 17 (34%) respondents feel that they have difficulty in finding relevant information. 19 (38%) with slow access speed, 17 (34%) with any other. 8 (16%) think that it takes too long a time to view and download pages, 3 (6%) are affected by the problem of information overload, 2 (4%) by slow access speed and difficulties in finding relevant information, 2 (4%) left the option blank, 1 (2%) has difficulties in finding relevant information, and 1 (2%) has difficulties in finding relevant information, being overloaded with information, and taking too long to view/download pages.
Conclusions
Development of responsible library materials, services, and environments for the new generation of users can be achieved by examining the library-related expectations of those users and making a meaningful effort to address deficiencies and change the current status in libraries. Do libraries and librarians have to adapt their well-organized organizations and systems to the needs of users rather than have users learn about and adapt to existing library systems? Because today's users are growing up in a society rich in technology and digital information, by blending the technology skills and mindset that users want to develop throughout their lives with the fruits of the academy, libraries can offer environments that grow with the new generation of users and enrich their learning and lifelong learning capabilities.

